Someone asks, “How’s the market?”
Most agents give
an answer based
on one number.
What if there were a better way,
to give a more complete view
of the real estate market
with a Simple answer?
A SimpleMarket Report gives you market statistics for an area that are quick to read, easy to understand, and fast to share. Don’t just tell a client what you feel about the market. Show your client where the market stands, where it’s been, and a data-driven idea of which way the market is moving.
Planned for December or January. No charge to sign up.


A quick read of the market showing Buyer, Seller, or Balanced market at a glance based on multiple market numbers.
What is in the report,
and how do I read it?
A report is five unique SimpleMarket tools, plus the other charts for market data that matters, a narrative summary, buyer and seller tips, and calls to action. All built from the same CVR MLS numbers you already work with and know, scored the same way every month, in a format that is easy to read and quick to digest. Be updated on current market conditions at a glance.
Key to the pictures:Red favors sellersBlue favors buyers
Is it a buyer’s market, balanced market, or seller’s market, and is it cooling, steady, or heating up? You can quickly answer the question your client asked, with a foundation in data built from the two scores below.
The SimpleMarket Read is a fast market snapshot that helps you answer “How’s the market?” with greater depth and clarity at a glance. You can quickly answer the question and have a deeper discussion, look like a real market expert with ease, versus the average agent who relies on one number and stumbles to back up their answer. The SimpleMarket Read is a composite of the SimpleMarket Scale and SimpleMarket Momentum in one concise visual tool.
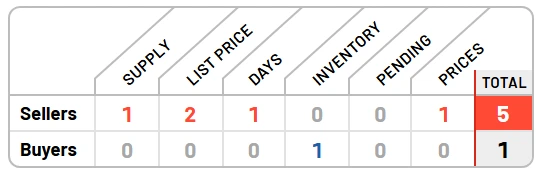
Six signals vote, each worth up to 2 points for buyers or for sellers:


These six are all considered in the SimpleMarket Scale, a composite score that is the foundation of the SimpleMarket Read. The totals decide the label. A market is rarely all one thing, so you can show a client which signals favor them and which do not.
is moving
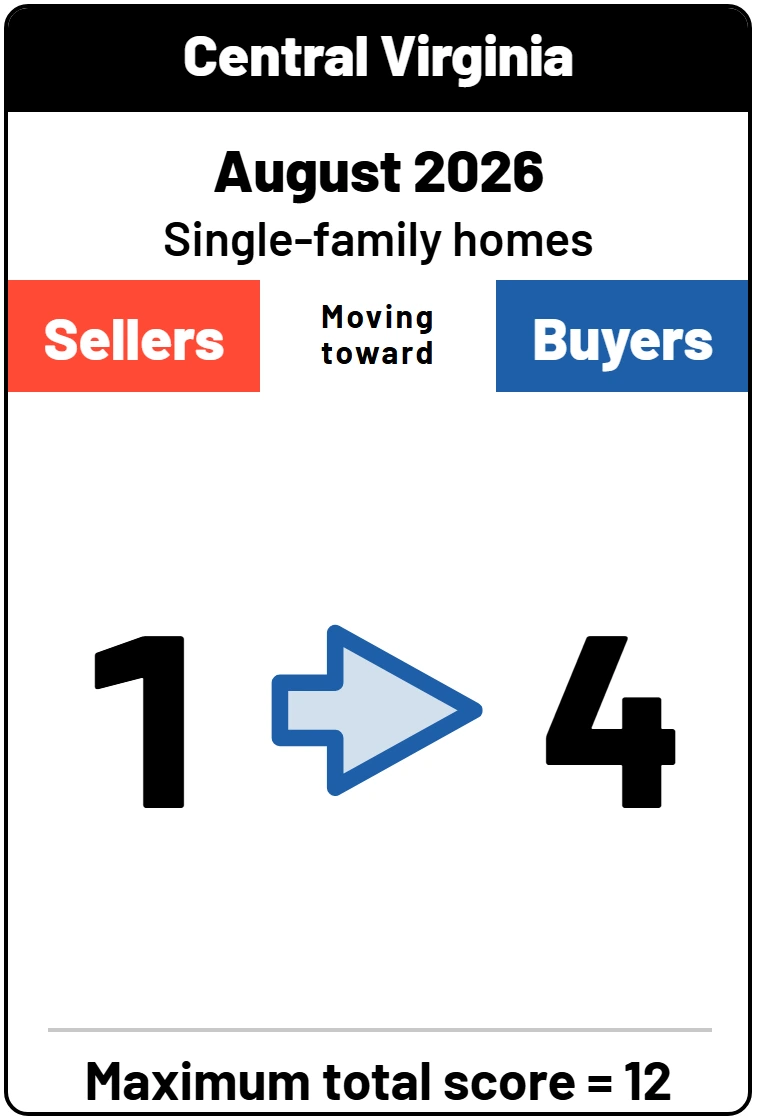
Current market numbers show you where the market is right now, but how does today’s market compare with the same time last year? The SimpleMarket Momentum answers that question. It is a composite too: six measures, each compared with the same month a year earlier:
Each earns up to 2 points for a side, and a net of 3 or more points either way is heating up or cooling.


A year earlier is the same selling season, so a slow winter does not read as a cooling market. For example, homes sell more slowly in January than in June every year. Comparing January with last January asks whether the market changed, not whether the calendar did.
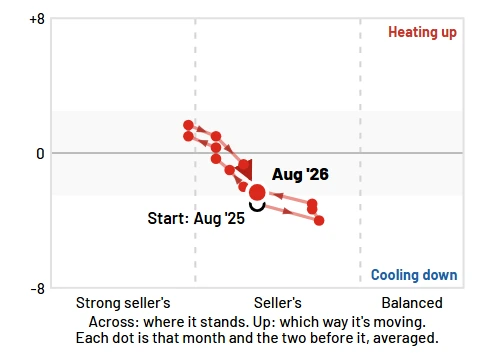
Take your market read to another level by watching the SimpleMarket Read over time. The SimpleMarket Trail plots the SimpleMarket Scale and SimpleMarket Momentum on one chart, with a dot for every month.
Each dot is a month averaged with the two months before it, which smooths out the noise. Markets do not jump around, they ebb and flow, like tides going in and out. The SimpleMarket Trail shows a turn while it is happening. Try it below.
of the market
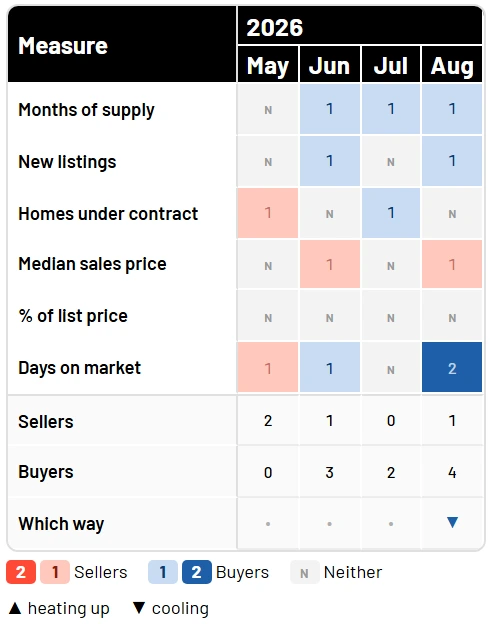
Another unique way to see the market over a real estate selling season of 4 months: a color-coded grid of recent months and the measures behind them, shaded by which side each month favored. A streak or a change of direction shows at a glance.
It is a visual glance at the six most important measures when you look at a market.
The numbers most agents look at,
and what they mean for buyers and sellers
One number tells one aspect of the market. Often it’s the interaction of these numbers, or how they go in the same or different directions, that gives a more complete picture of what type of market it is. Rising prices with growing supply say something different from rising prices with shrinking supply, and quick sales with plenty of homes to choose from say something different again. Read the charts as a set to get a fuller perspective. The real story is in how the numbers move in relation to one another.
Important Market data included with
Every chart answers a question a client asks. Here is what each one tells you.
 Median and average priceThe median is the middle sale price, so a few very high or very low sales do not move it. The average is much more sensitive to outlying values and moves more. When the two drift apart, a few unusual sales are pulling the average in one direction or another, so look at both and compare them. That gap (or lack thereof) is worth explaining to a client.Buyers: A rising median means paying more, but it could also price some buyers out of competing for homes.Sellers: Pricing your home correctly is one of the most critical aspects of selling your house and putting together a strategy that results in a sale.
 Months of supplyHow long today’s homes for sale would last at the current pace of sales. Under about 3 to 4 months favors sellers, and over about 6 favors buyers. Between those ranges neither side is really favored. This is a fundamental perspective of supply and demand.Buyers: As supply increases, buyers gain advantages. Typically this means more choice, more time, and more room to negotiate.Sellers: Lower supply could mean less competition, stronger pricing, or that homes are selling quickly. As months of supply rises, your home needs to be more competitive.
 New listingsThis is a measure of the fresh supply of homes arriving on the market for sale each month, not new construction homes. More new listings do mean more fresh choices and new competition, and many times this is a seasonal change rather than a true temperature change in the market. Fewer choices help sellers hold their price more firmly.Buyers: Fewer homes new to the market leave buyers with less to pick from and can create pressure for buyers to choose from what’s available or to wait.Sellers: Competition can be good for you if you have a better product to sell or are priced more aggressively.
 Pending salesHomes currently under contract give a sense of demand right now, before closing. While the contract price is not known, it is a measure of activity in the market.Buyers: Unfortunately, pending sales are usually the homes that got away. Someone else came to an agreement to buy that home. Don’t give up hope, though: sometimes these deals fall apart, and sometimes you can capitalize on that.Sellers: Active listings are the competition, pending sales represent market activity, and sold homes support pricing for appraisals and hint at where new listings should be positioned to compete.
 Closed salesCompleted transactions, or closed sales, are the finished record of the market and are also significantly affected by the housing market season. They help confirm a trend, though they report what already happened. Set them beside the same month last year to see whether more or fewer homes are changing hands in a similar real estate season.Buyers: This is the other side of new listings coming to the market, and it is a good measure of the trend of the market.Sellers: Closed sales are a clue for pricing a home for sale, but remember they show where the market was, not where it is going. Price for the market ahead, not behind.
 Homes for saleThis is simply the amount of inventory a buyer can choose from, and it is a great measure to look at year over year. It is also one of those measures that is very seasonal, so one month can’t be compared to the next month, but changes year over year can signal a difference in the market.Buyers: More choice tends to favor buyers and can soften sale prices or allow for more buyer protection contingencies. Buyers may be able to be pickier about what they will accept.Sellers: Look deeper: is this a seasonal change or a shift in the market? Only other numbers and history will guide you. Look at the calendar and guidance to get a better perspective.
 Percent of list priceHow close homes sell to their asking price. A 1-2% increase or decrease is thousands of dollars on a home sale, but it’s also a small fraction of the overall price. A list price is just the first offer, not a guaranteed retail price or value.Buyers: When the figure approaches or crosses 100%, buyers are competing against other buyers, have fewer choices, have little room for negotiation, may need to put in stronger offers, or a combination of all of these. Having a good strategy is critical when putting together an offer.Sellers: If other sellers are getting close to or above 100%, you may be able to expect stronger offers closer to your list price, if you’re in line with the market. On the way down, sellers need to price ahead of the market or they may end up chasing it.
 Days on marketHow fast homes sell is one indicator about the temperature of the market. Lower priced homes typically have fewer days on market than significantly higher priced homes in the same market. A few slow or fast listings can artificially stretch the average and give a distorted picture, so it’s best to look at the median.Buyers: Low days on market mean quick sales to qualified buyers, a high number of buyers, or low inventory, and buyers need to take action when homes appear on the market.Sellers: The longer a home sits on the market, the higher the tendency for questions to develop about what could be wrong with the home.
Why isn’t one number enough?
One number tells one part of the story. The SimpleMarket Scale, one of the two scores behind the SimpleMarket Read, is a simple-looking tool with several details below the surface: six market numbers, each voting for sellers or buyers.
What is meant by Seller’s Market, Balanced Market, or Buyer’s Market?
- Seller’s MarketDemand outpaces supply. Buyers face competition from other buyers, fast sales, rising prices, and maybe lower inventory. Sellers hold more negotiating leverage, usually quicker sales, and fewer contingencies.
- Balanced MarketSupply and demand are roughly equal. Conditions are stable, with negotiating power relatively balanced between buyers and sellers.
- Buyer’s MarketSupply exceeds buyer demand. Values may soften, flatten, or decline, properties stay on the market longer, less competition for homes. Buyers have more choices, better negotiation leverage, and more contingencies.
There is no established standard for how many “Months Supply” is considered a buyer’s or seller’s market: some call under 3 months a seller’s market and over 6 a buyer’s market. Regardless of the cutoff, most agents base this on one number that only tells one small part of the story.
Months of supply of inventory
Behind the SimpleMarket Scale
- Supply+1
- List price+2
- Days+1
- Inventory+1
- Pending0
- Prices+1
Sellers 5, Buyers 1Net score +4 to Sellers
Sample numbers. Red favors sellers,
blue favors buyers.
Determining whether it’s a buyer’s market or a seller’s market takes more than one number. Months of Supply is a fair measure, and it sits beside days on market, sale price against list price, inventory, pending sales, and the price trend. Those measures do not always agree, and when they disagree, that is important data for you as an agent to know and important to show a buyer or seller client. Some market data favors buyers more, while other data may favor sellers. Add other information from the SimpleMarket report, and now you really shine as a market expert.
SimpleMarket gives you a multi-dimensional glance at the market using several data points, to show not only whether it’s a buyer’s or a seller’s market, but how strong the market is, and the direction of how today’s market compares with a year ago.
Different markets reflect different numbers. National numbers do not describe Virginia’s market, and Virginia’s may or may not describe Richmond’s. Hanover County is a different market from Chesterfield County, and the Fan District in the City of Richmond is a different market from a rural property in Goochland.
Stop guessing, and don’t determine the market on a single number. Show a more complete picture grounded in data so you can talk about the market with confidence, and you look like what you are: the agent who knows the market and can back it up with data.
What does it look like when a market shifts?
Markets are in constant movement. The SimpleMarket Trail visually shows you where the market has been and allows you to see and show clients how the trails of different markets are distinct.
Every market is different, and so is every season. Pick a stretch of time and watch market changes, one month at a time: where the market stood, and which way it was heading. Or compare different markets to help see how 2020 is not the market of today.
The last 12 months of the Richmond Metro.
Show the trail of breadcrumbs: where the market has been, to see the path the market has traveled in the past and get a hint of where it could be going moving forward, also compare different markets.
The SimpleMarket Trail. Open the full Market Report.

More than boring data,
A report presenting You
as the Market Expert
Customize the SimpleMarket report with your name, photo, logo, and colors on both pages, and with the appropriate disclosures, including your brokerage information. Each month you can write a note in your own words in place of the supplied buyer and seller tips, add a call to action under it, and set the call to action in the footer that says how readers reach you.
Your report is ready to go as soon as it is delivered, and you can customize it further every month: fully automatic or modified by you, your choice. Any customization you make stays until you change it.
Features that make the report reflect your personal brand
- ✍️A narrative summary written for youImportant numbers for each month explained in plain words, automatically written for you and as your take on the market.
- 💡Buyer and Seller tips or a note from youPlain advice for buyers and for sellers from that month’s numbers, or a personal note from you. You can even change what you offer each month.
- 🎛️Two calls to action, custom or presetA call to action under your personal note, written by you or picked from a preset selection. And a second call to action in the footer, which tells readers how to reach you.
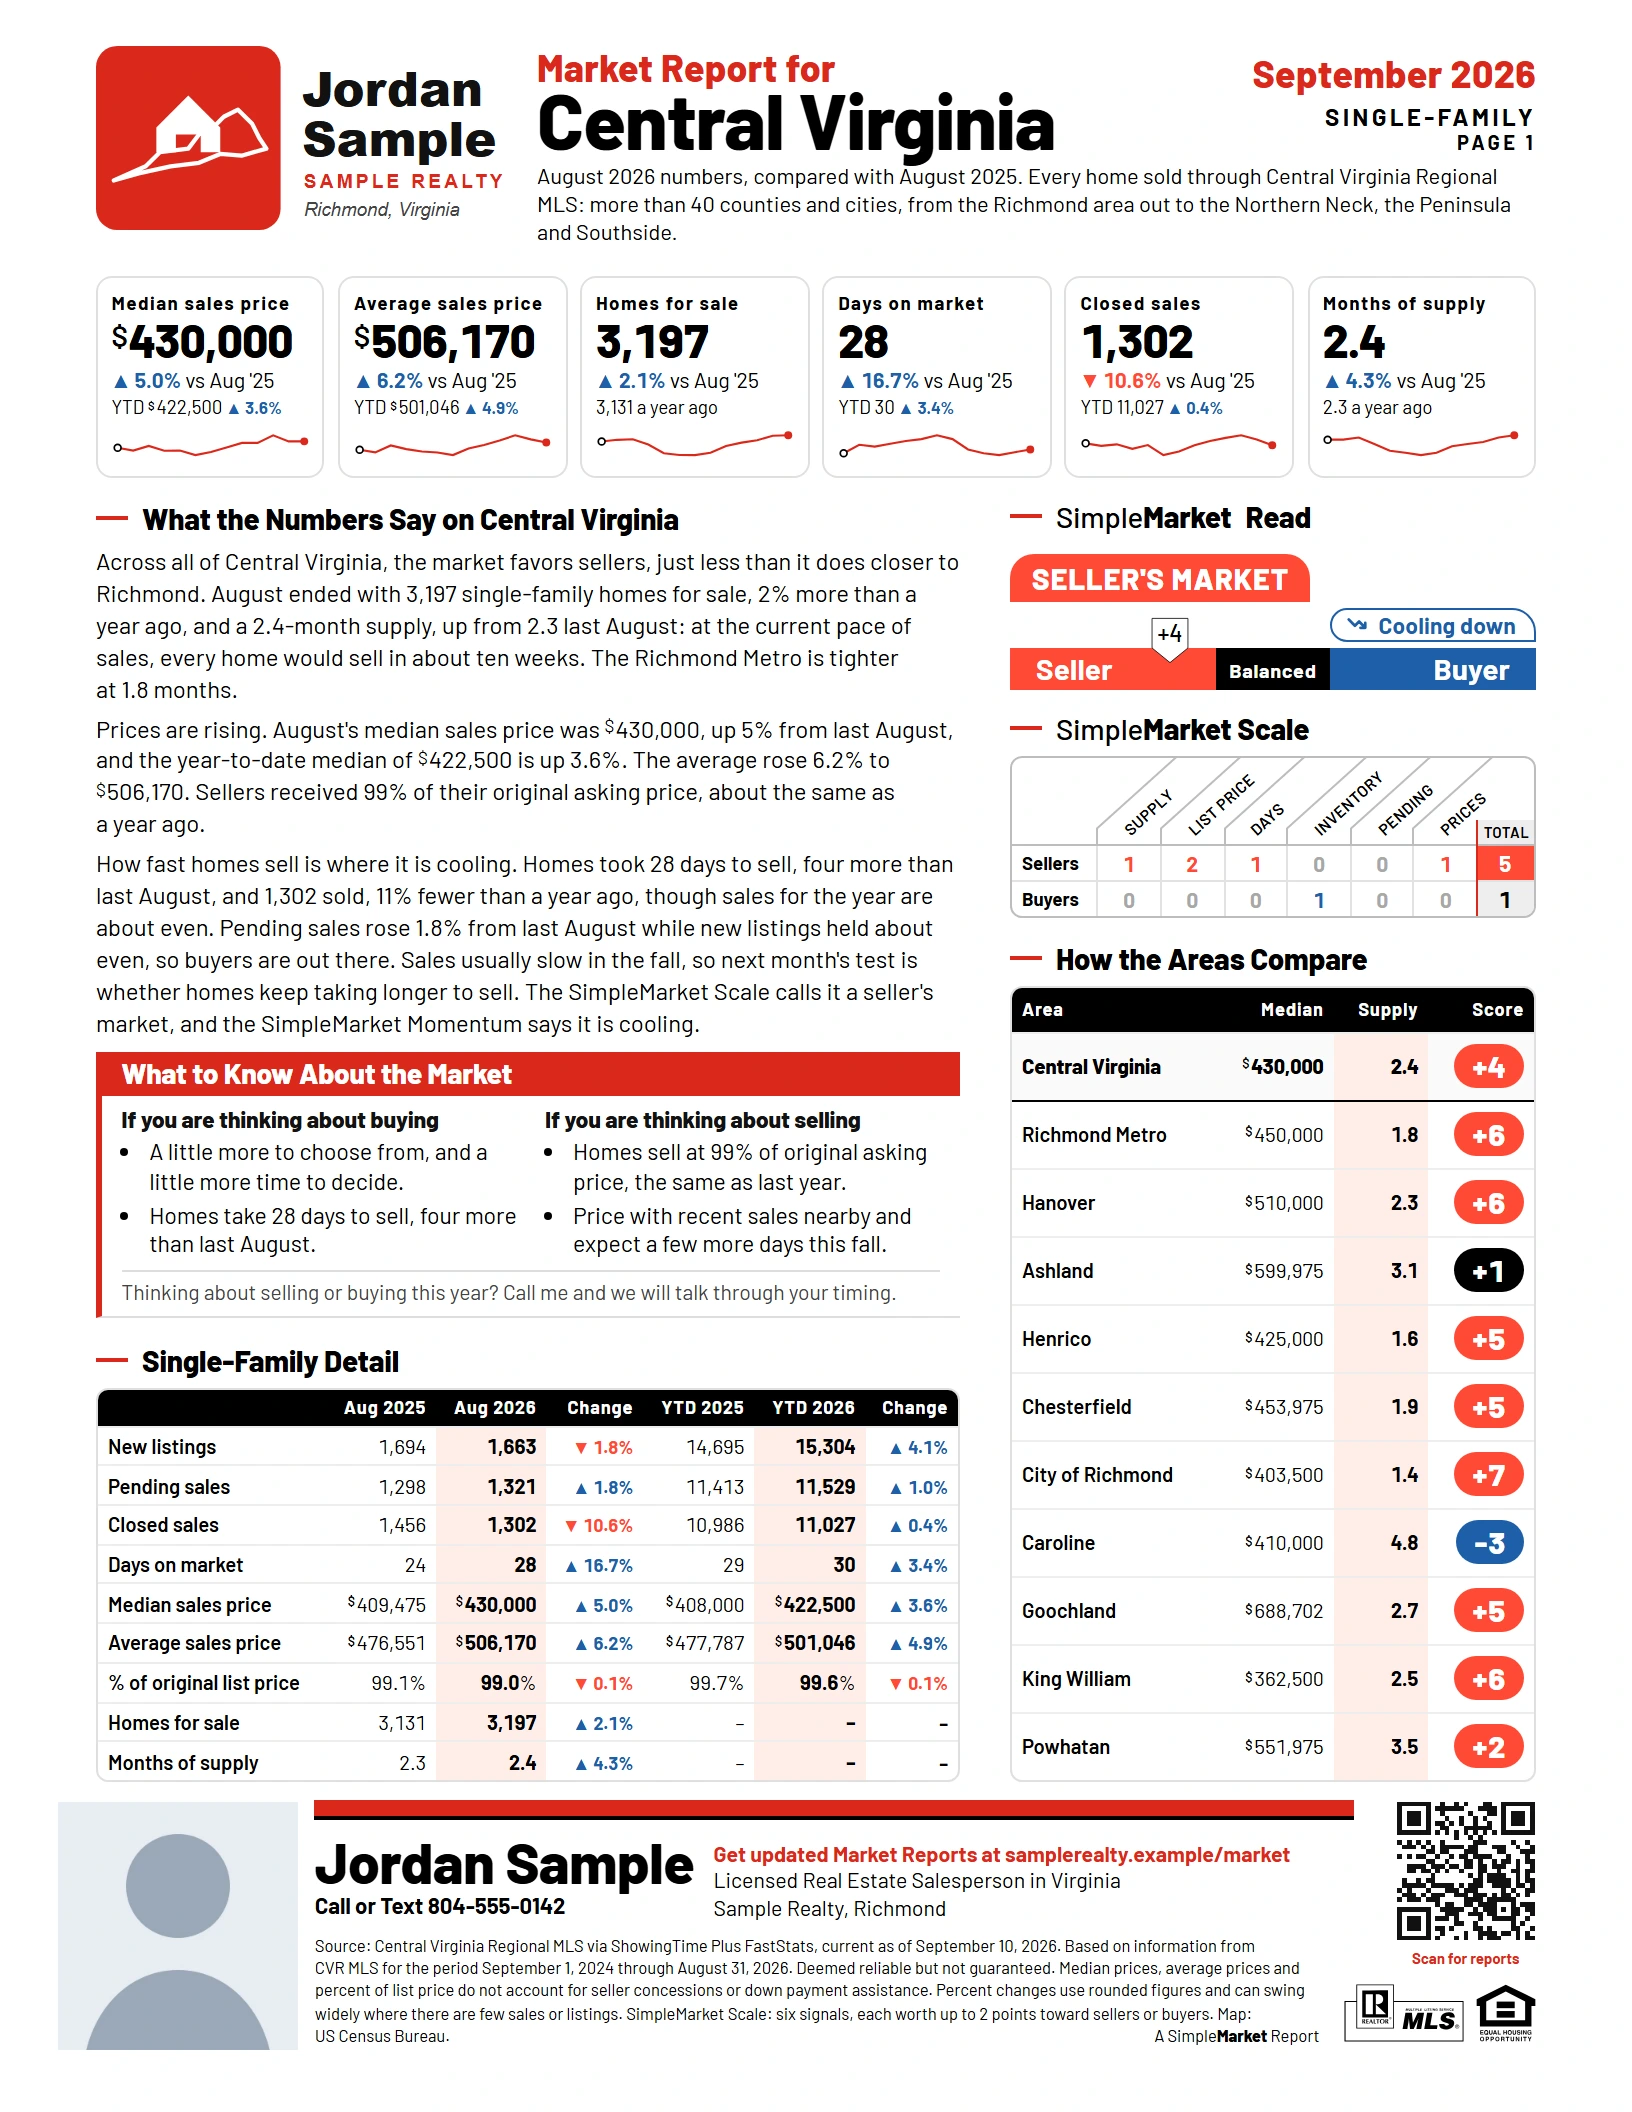
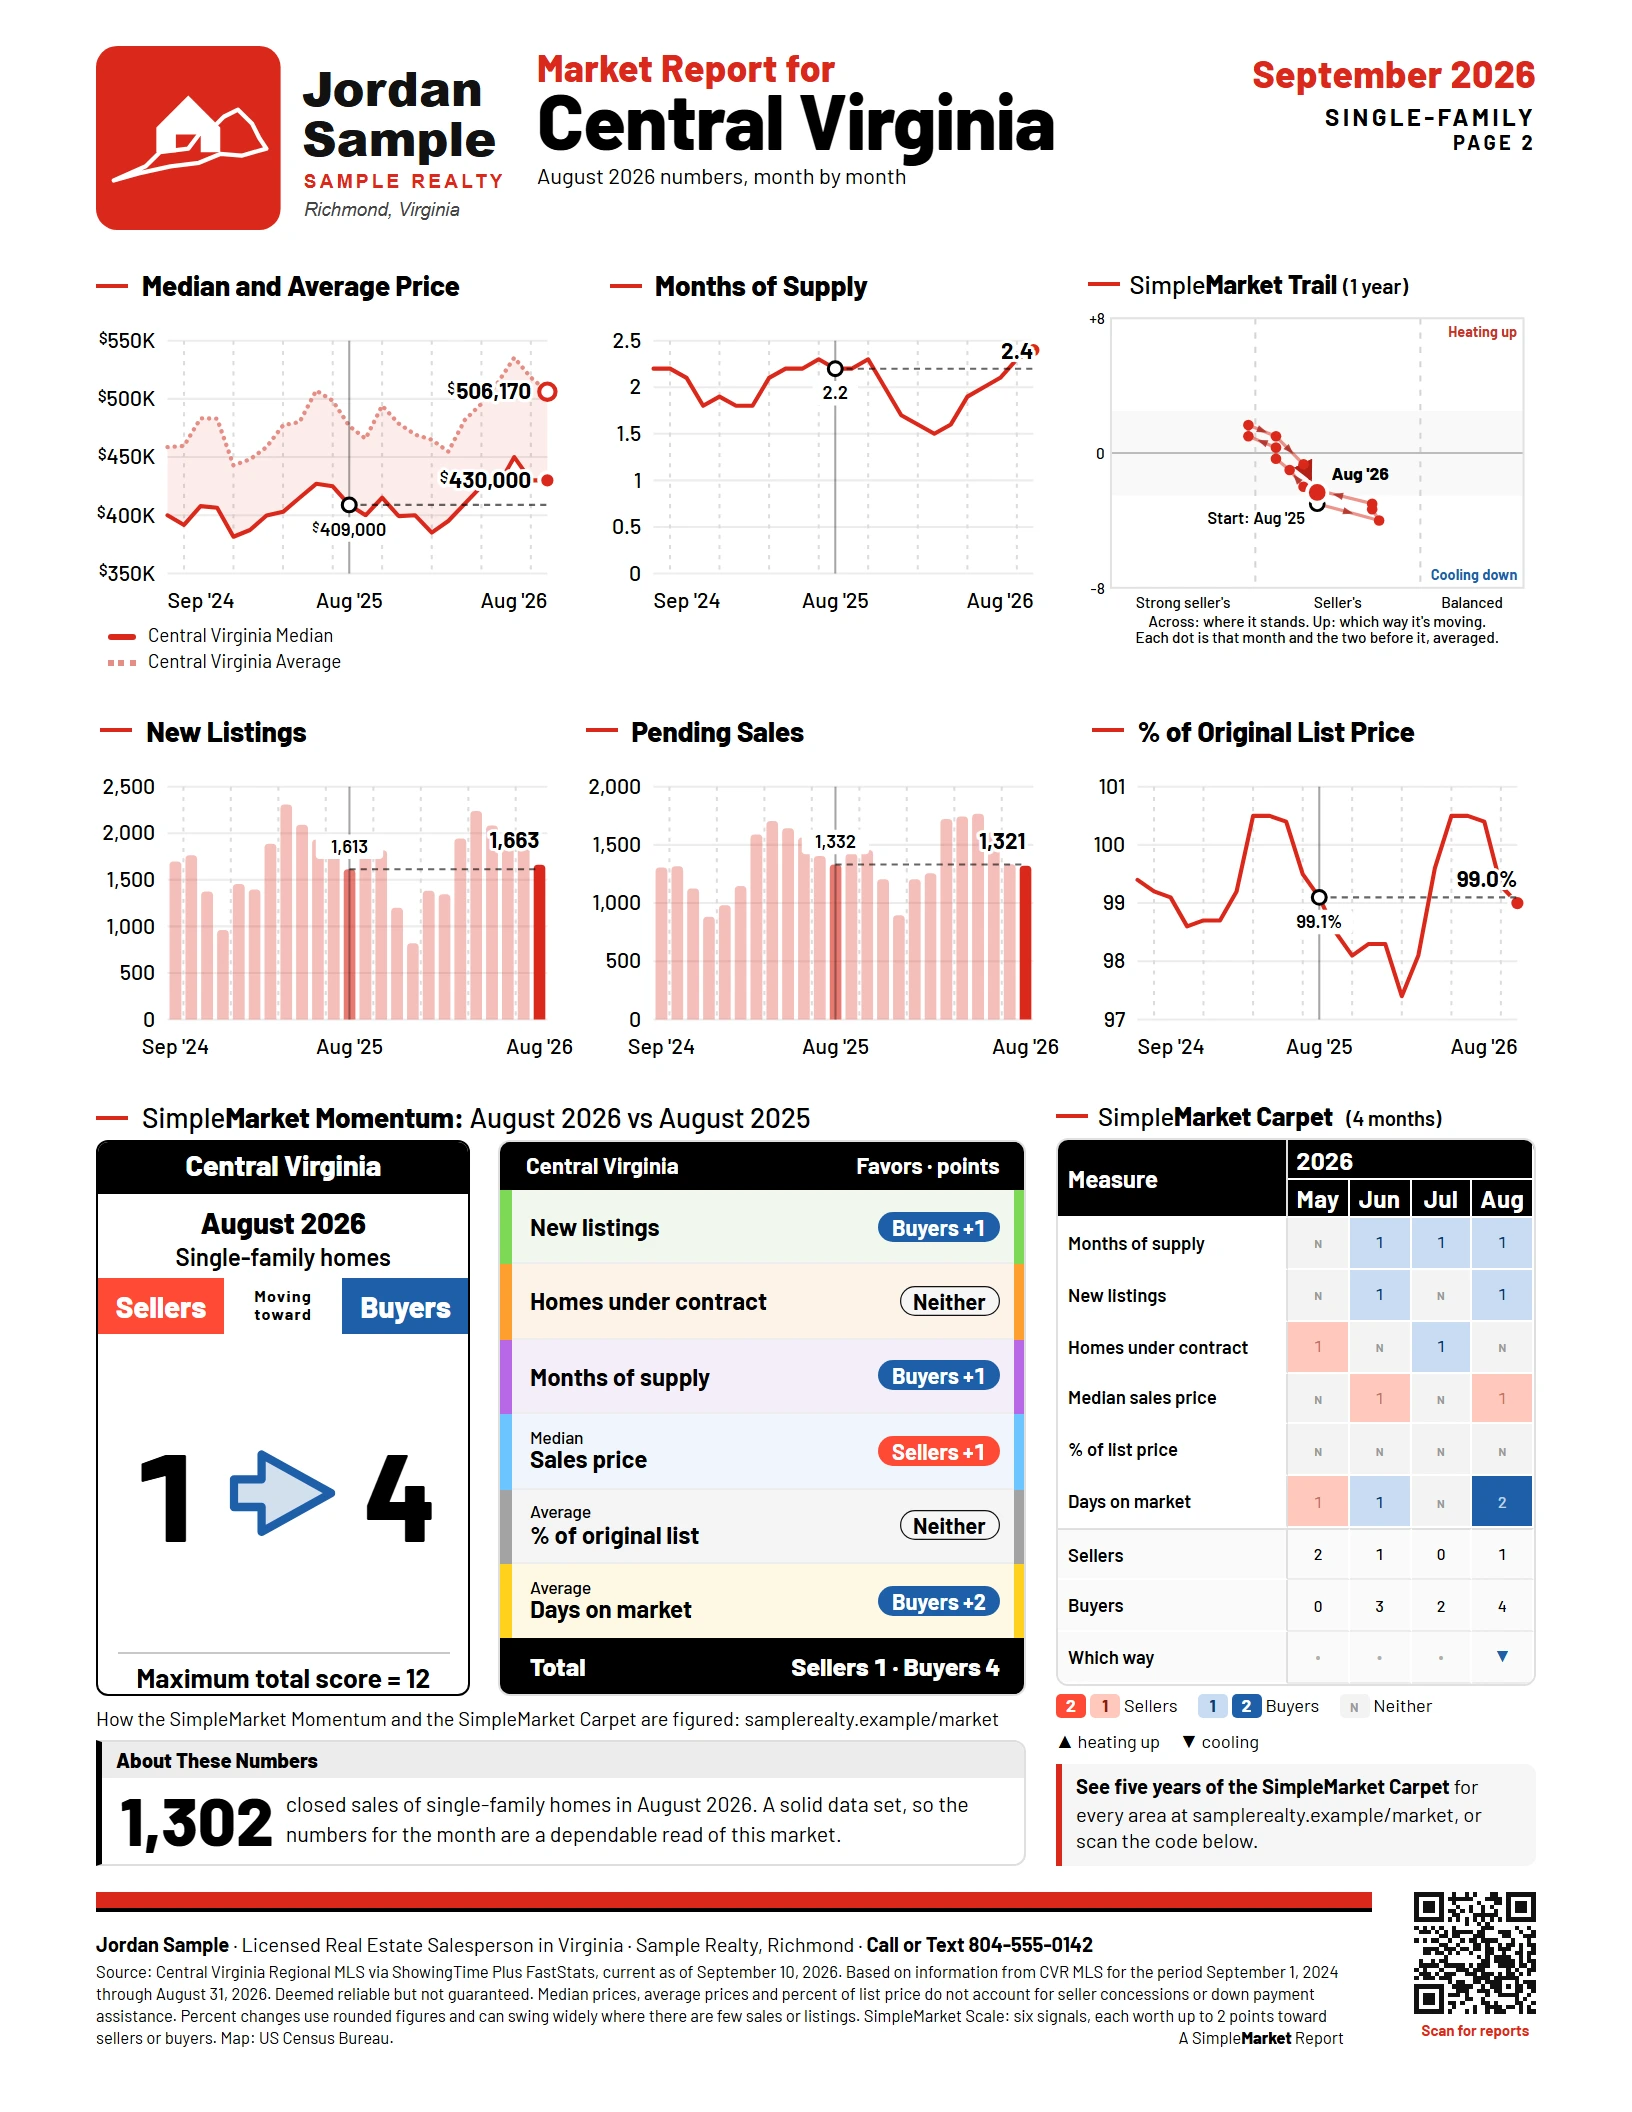
A sample for a made-up agent, Jordan Sample of Sample Realty. Page one answers the question; page two shows the work behind it.
What do I get each month?
A fast, simple update, delivered around the 15th of the following month, when CVR MLS finalizes the numbers, so you can talk about the market intelligently and look like the market expert you are. Most agents will quote a headline number. With a SimpleMarket report you can give a reading of the entire market, at a glance.
Planned for the release:
- 🌐An online, branded web page of your own with the current report and the animated SimpleMarket Trail, easy to share from a phone, tablet, or computer at a listing appointment or a buyer consultation.
- 🗂️An archive of your past monthly reports, kept from the month you subscribe.
- 🖼️A picture of the month’s SimpleMarket Scale to post.
- 🏢A condo and townhome report for the areas you subscribe to, wherever there are enough sales for an accurate read of the market.
The first release may not include everything on this list. I will tell you exactly what is in it before you decide anything.
How are SimpleMarket reports different from
other market updates?
The numbers, left to you
Some market reports are a simple sheet or two of information and data that hand you data and leave the explaining to you. It’s up to you to process it to make any sense of the information.
Other market reports allow you to put your name on the report, or maybe you make your own, typing the numbers in, or you post a graphic that has just a few numbers for your market. But what do the numbers really mean?
The numbers, read for you
SimpleMarket reads the CVR MLS numbers for you, scores them the same way every month, puts them into a report you can digest at a glance and easily give an explanation deeper than a headline.
The SimpleMarket Scale, SimpleMarket Momentum, SimpleMarket Trail, and SimpleMarket Carpet are unique to the SimpleMarket Report, and cannot be found anywhere else. A FREE subscription gets you the Central Virginia report with these charts. A paid subscription gives you access to more niche areas and personalizes the reports with your name, a headshot, a personal note or buyer and seller tips, along with 2 different calls to action. Either way, you have an advantage over agents who do not have access to the SimpleMarket Report.
Each unique SimpleMarket chart is a composite reading of the market: several measures scored and combined, not just a single number, and designed to give you a deeper understanding of the market at a glance. That is what makes SimpleMarket tools a more complete view of current market conditions.
Where do the numbers come from?
The numbers come directly from CVR MLS statistics, as of the date printed on every report. The MLS finalizes the data shortly after the close of the month and publishes those numbers as the “official record.” Raw numbers can still change later, but a report needs a cutoff for publishing, so a figure can shift a little after the report is made.
The scoring rules are fixed and consistent every month, not guessed or based on subjective information. The results are objective and consistently applied, so anyone can check how the SimpleMarket Read and other tools were developed for each month.
Which reports are available?
There are 10 reports across Central Virginia, and most have a condo and townhome report too. Pick the area you work, a group of areas, or all of the SimpleMarket reports to have a comprehensive picture of the different markets in Central Virginia.
Currently planned individual reports
🏠 single-family report
🏢 condo and townhome report
Central Virginia covers the whole CVR MLS area, more than the counties shown.
Packages
Individual ReportsGet a single county, or a set of individual counties,
to cover the area you work in. Or choose the
Richmond Metro or the entire MLS (Central Virginia)
area as a single report.
Core Central Virginia Package Best valueAll ten core reports currently available.
Metro Pick Five PackageCity of Richmond, Chesterfield, Henrico, Hanover Counties, plus Richmond Metro Regional Report.
Custom Pick Five PackageAny four counties, plus the Richmond Metro Regional Report or Central Virginia Regional Report.
Pricing still to be determined.
Want to know when SimpleMarket Reports are available?
Sign up today for the FREE subscription of the Central Virginia Regional Report by using the form below. We will send you the latest SimpleMarket Central Virginia report and will notify you when the custom reports are released. The plan is to release the first customized editions in December 2026 or January 2027. Signing up today commits you to nothing.
Questions? Call 804-Michael or Text 804-642-4235.
Who is behind SimpleMarket Reports?
I’m Michael Hottman, also known as 804-Michael because my number spells my name, a Virginia real estate broker with Malcolm Real Estate in Ashland. I built these measures for my own listing appointments and buyer consultations, because “it depends” is not much of an answer to give a client.
I talk with many agents who want to understand the market numbers better, and who want an easy way to see and explain them. So I turned my own report into one they can use: a version with their own name on it that they can share as their own, to:
- Build their understanding of the market.
- Share their knowledge with prospective or current clients.
- Be known as the agent who has a command of market data and how to explain it.